Per-process monitoring
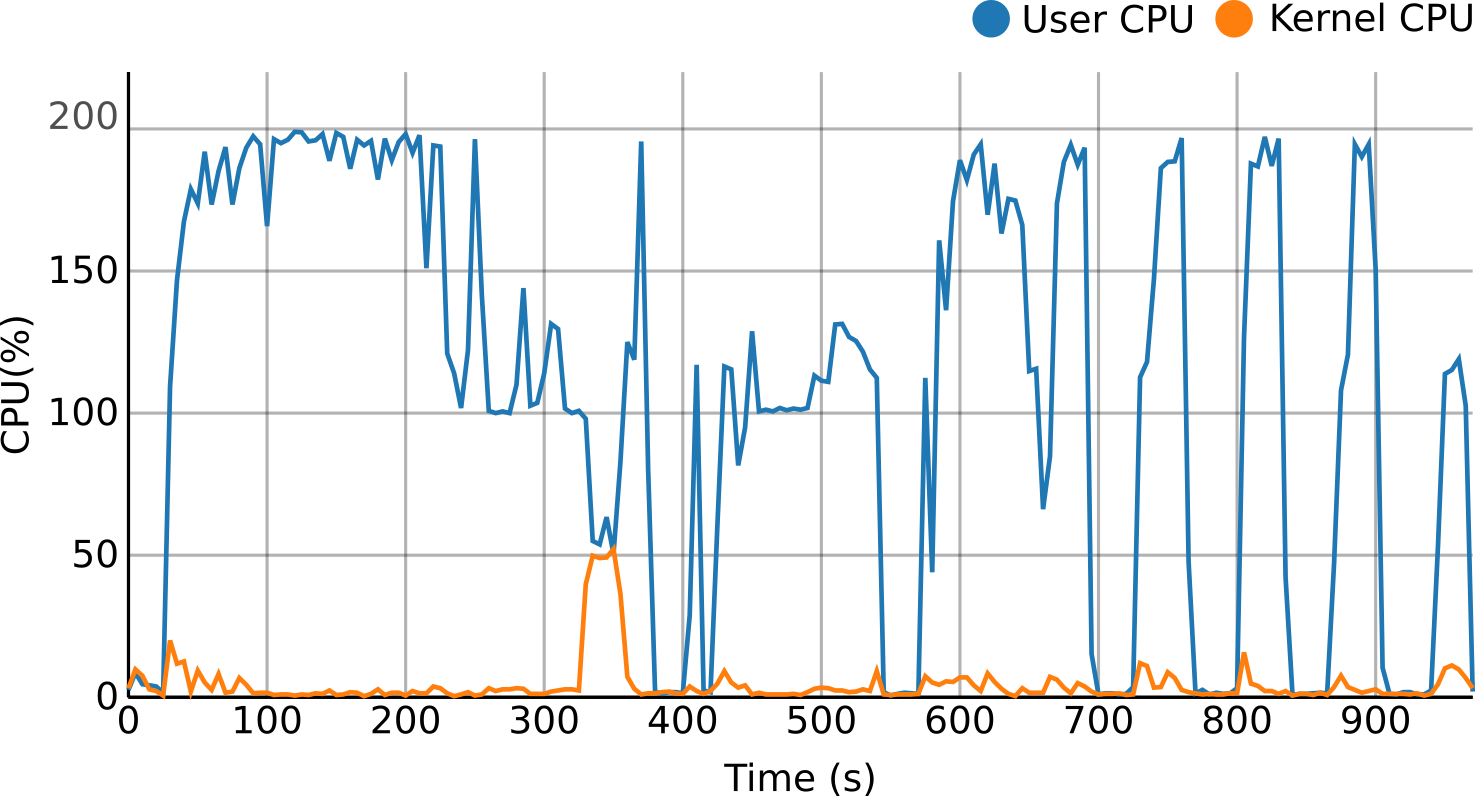
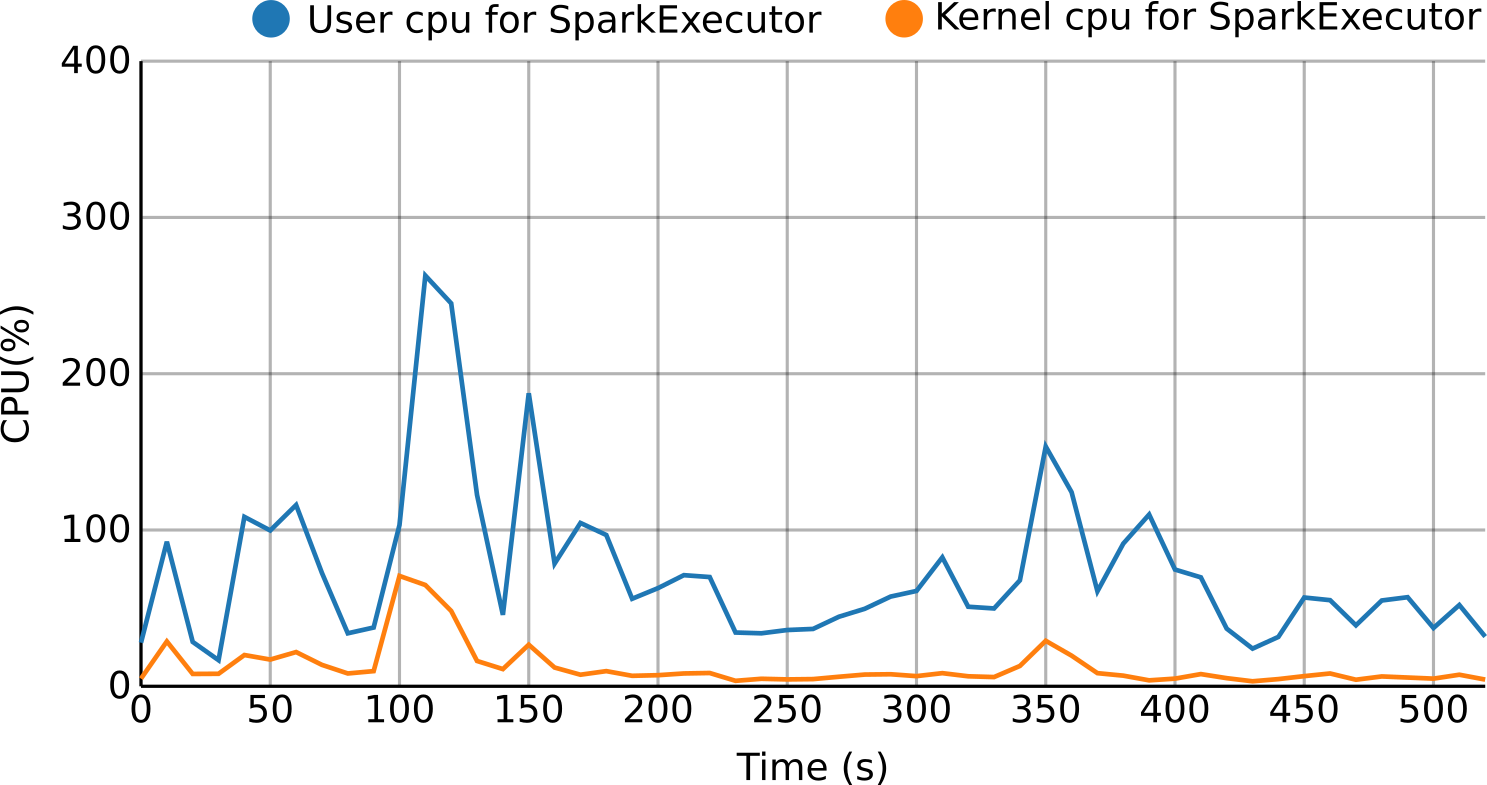
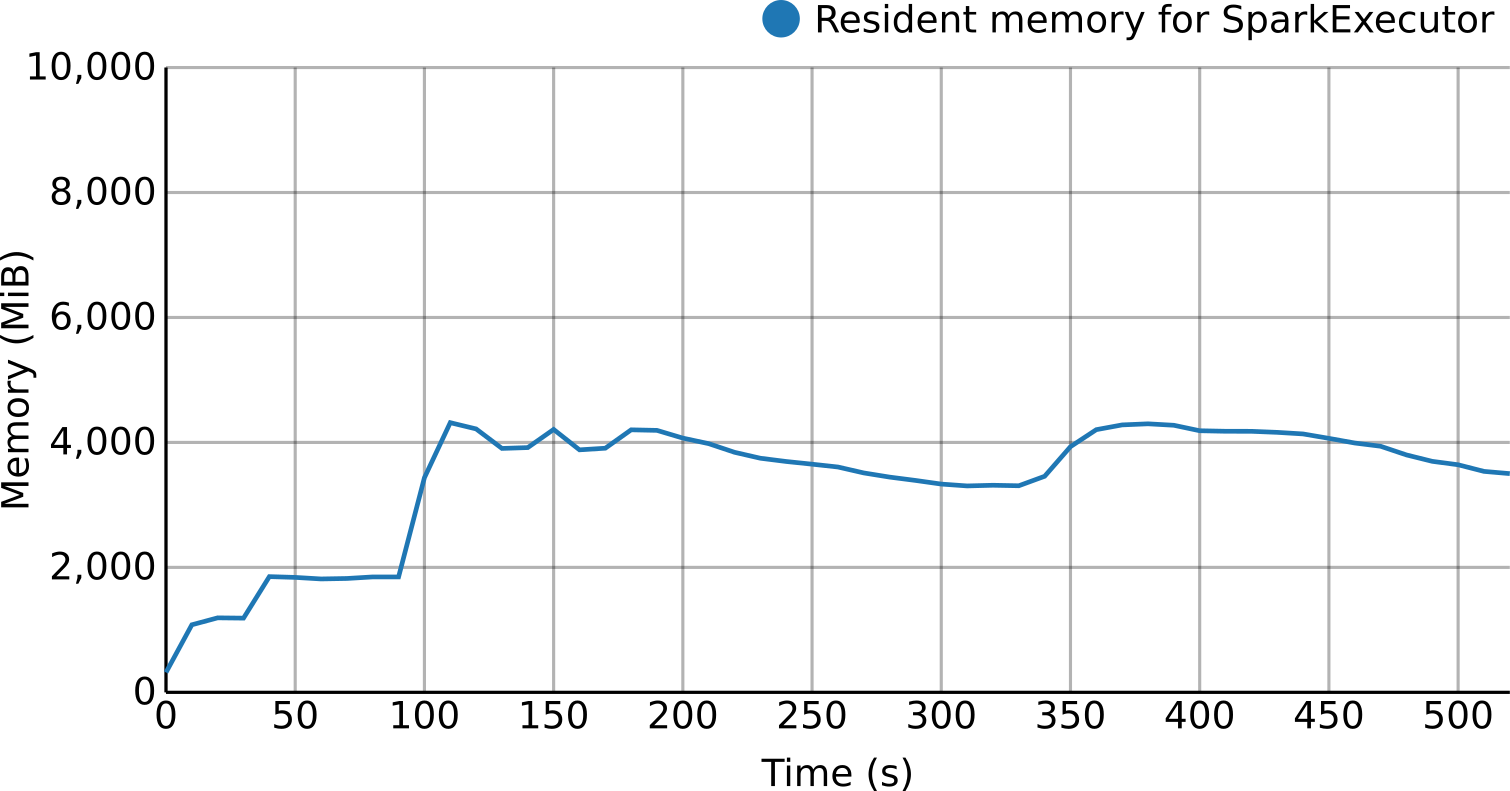
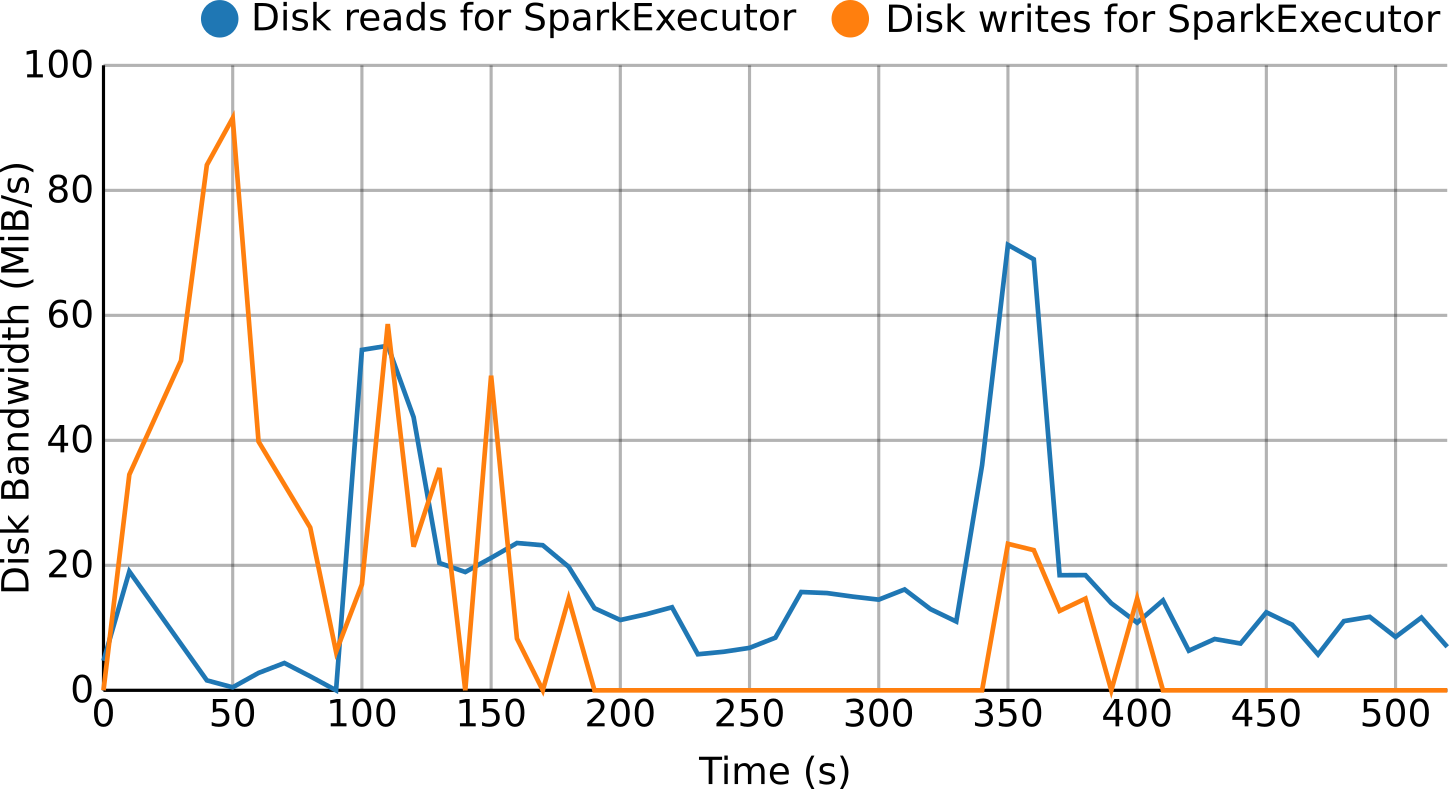
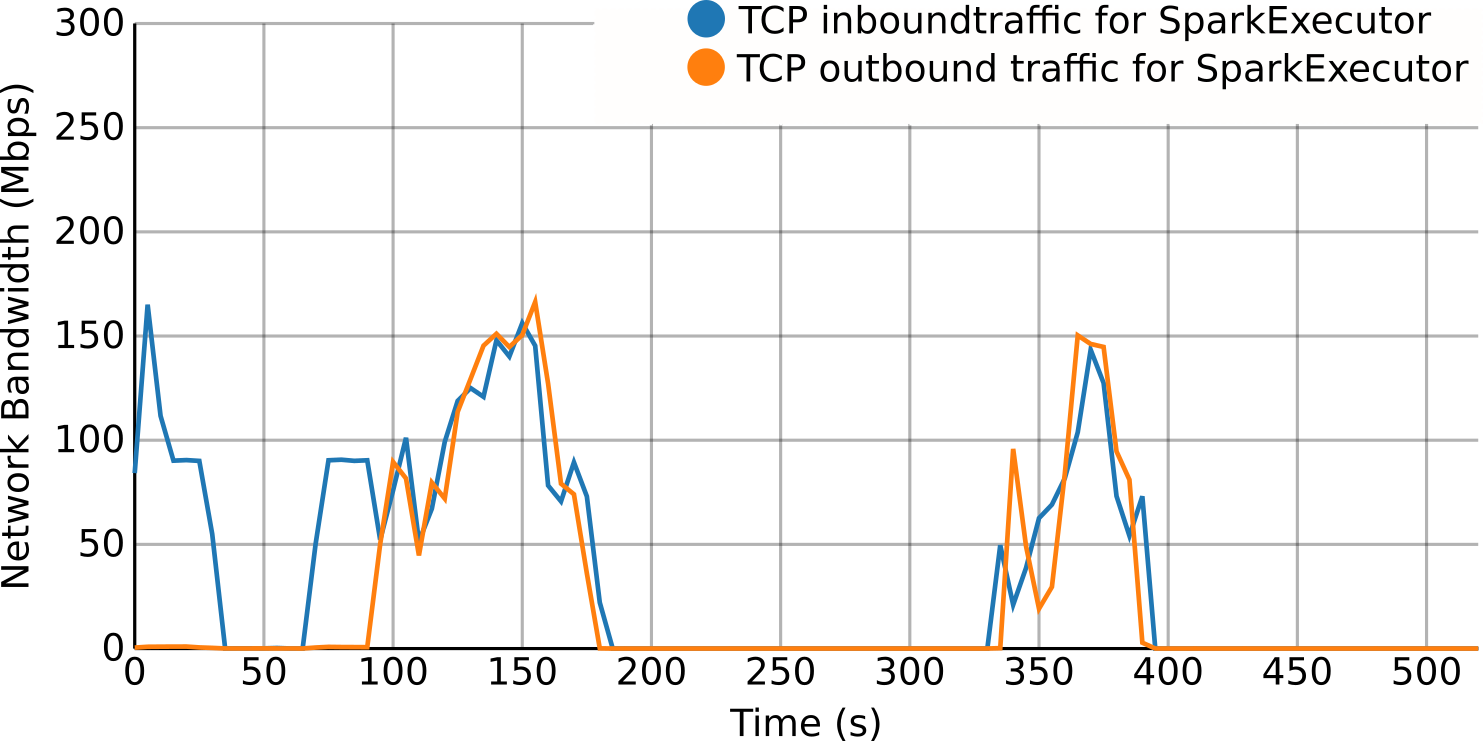
For the per-process monitoring, resource usage metrics (e.g., CPU, memory, disk, network...) are retrieved, processed and pushed to a time series database creating a stream. Thanks to this approach it is possible in real-time to see and use this data for several purposes like visualization, reporting or to detect situations like resource bottlenecks, loss of efficiency or even resource contention.
Moreover, the per-process approach allows to deploy this monitoring solution on a broader type of virtualized environments, from bare-metal to virtual machines (Cloud instances) or even containers.
Real-time profiling
For the real-time profiling of Java-based applications, the perf utils are used to continuously get system-wide CPU stacks, using a configurable frequency. The stacks are then processed, marked to differentiate them across applications and pushed to a document-based database. Once in the database, the stacks can be retrieved and processed with several tools (console script, web interface) to create the interactive flame graphs.
These flame graphs can be created in real time with data collected between two time points on an application's execution. Once created, information regarding the percentage of spent time for each class can be interactively analyzed in a recursive way by following the stack calls.

Figure 6: Example of a flame graph extracted during the execution of a Hadoop TeraSort
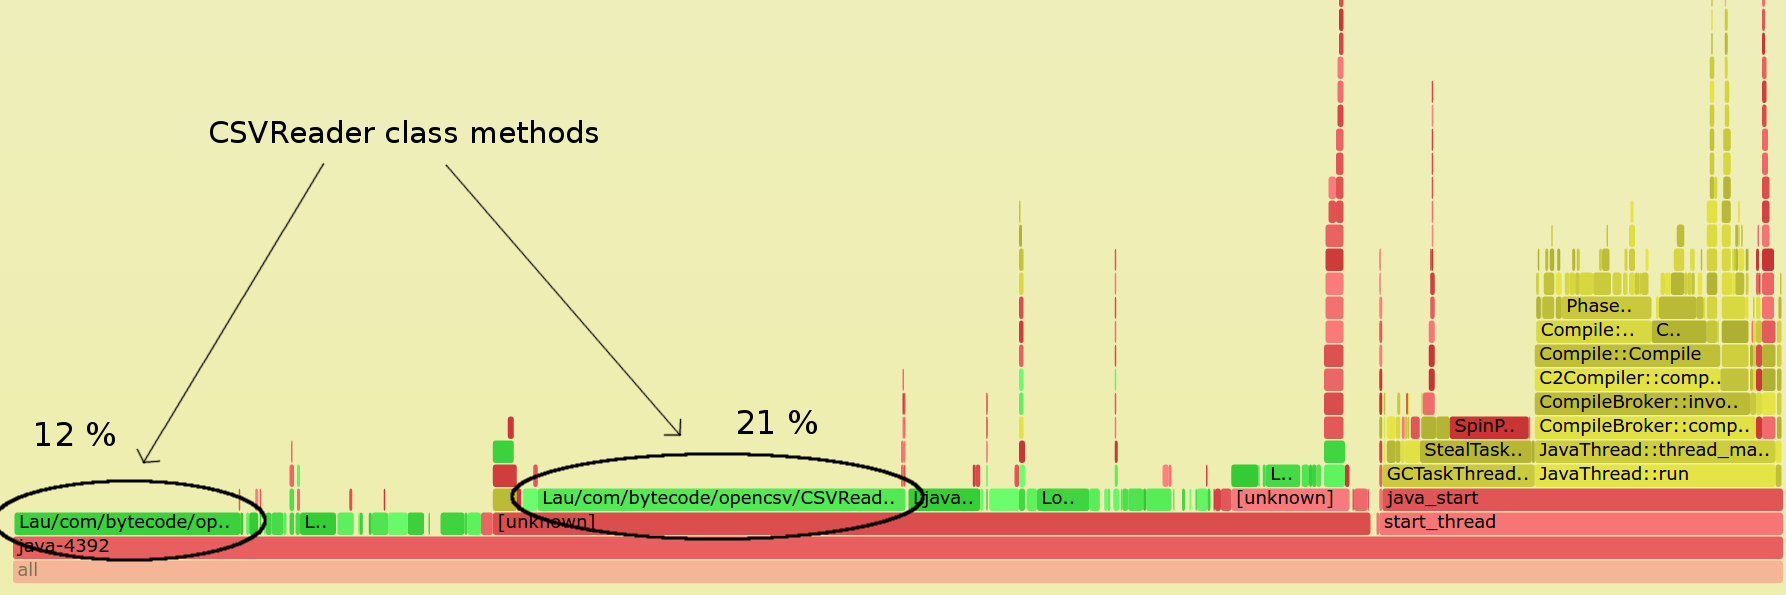
Figure 7: Flame graph for a SQL join task in Spark, showing the most consuming methods being the CSV readers
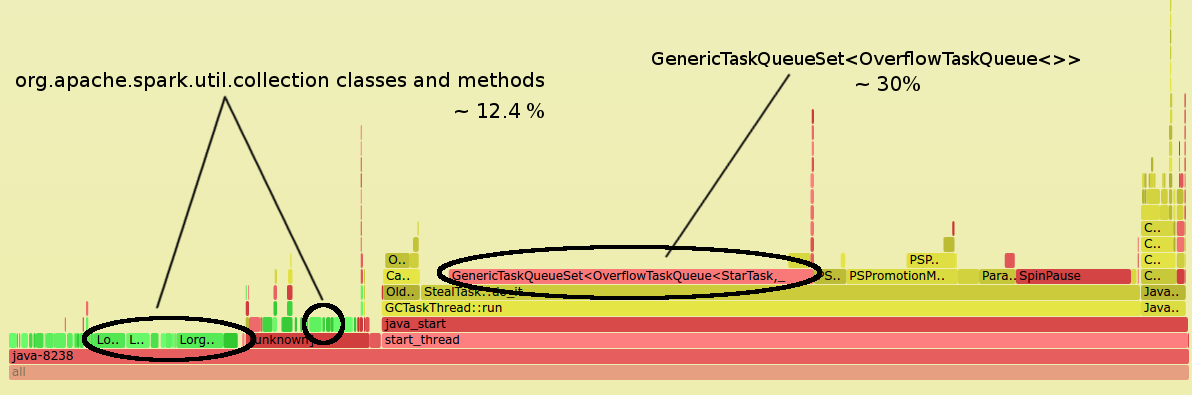
Figure 8: Flame graph for a Spark job that combines JVM and application stacks, showing a bottleneck in JVM administration